
Search for Indicators
Healthy Families Mothers & Babies Initiative (CDC-REACH)
 |
Working with African American families on the Mississippi Gulf Coast to strive to live healthier lives by embracing breastfeeding, good nutrition and a tobacco-free lifestyle. The Gulf Coast Healthy Families, Mothers, and Babies Initiative is a five-year cooperative agreement funded by the Centers for Disease Control and Prevention as part of the R.E.A.C.H. (Racial and Ethnic Approaches to Community Health) Program to reduce health disparities among populations with a high risk of chronic diseases. The Mississippi Gulf Coast is one of 31 communities selected across the nation. R.E.A.C.H. is a stepping stone for partners across our Gulf Coast to create a network to strengthen and empower families and improve our health outcomes. |
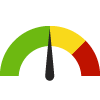
Indicator Gauge Icon Legend
Legend Colors
Red is bad, green is good, blue is not statistically different/neutral.
Compared to Distribution
 the value is in the best half of communities.
 the value is in the 2nd worst quarter of communities.
 the value is in the worst quarter of communities.
Compared to Target
 meets target;
  does not meet target.
Compared to a Single Value
 lower than the comparison value;
 higher than the comparison value;
 not statistically different from comparison value.
Trend

 non-significant change over time;
 significant change over time;
  no change over time.
Compared to Prior Value
 higher than the previous measurement period;
 lower than the previous measurement period;
 no statistically different change from previous measurement period.
 Significantly better than the overall value
 Significantly worse than the overall value
 Significantly different than the overall value
 No significant difference with the overall value
 No data on significance available
Adults 20+ with Diabetes
Value
Compared to:
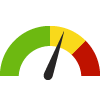
Adults 20+ with Diabetes County: George
Adults 20+ with Diabetes County: George
8.0%
(2021)
Compared to:
MS Counties
The distribution is based on data from 82 Mississippi counties.
U.S. Counties
The distribution is based on data from 3,074 U.S. counties and county equivalents.
Prior Value
(7.8%)
Prior Value compares a measured value with the previously measured value. Confidence intervals were taken into account in determining the direction of the comparison.
Trend
This comparison measures the indicator’s values over multiple time periods.<br>The Mann-Kendall Test for Statistical Significance is used to evaluate the trend<br>over 4 to 10 periods of measure, subject to data availability and comparability.
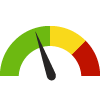
Adults 20+ with Diabetes County: Hancock
Adults 20+ with Diabetes County: Hancock
9.3%
(2021)
Compared to:
MS Counties
The distribution is based on data from 82 Mississippi counties.
U.S. Counties
The distribution is based on data from 3,074 U.S. counties and county equivalents.
Prior Value
(8.2%)
Prior Value compares a measured value with the previously measured value. Confidence intervals were taken into account in determining the direction of the comparison.
Trend
This comparison measures the indicator’s values over multiple time periods.<br>The Mann-Kendall Test for Statistical Significance is used to evaluate the trend<br>over 4 to 10 periods of measure, subject to data availability and comparability.
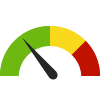
Adults 20+ with Diabetes County: Harrison
Adults 20+ with Diabetes County: Harrison
11.6%
(2021)
Compared to:

MS Counties
The distribution is based on data from 82 Mississippi counties.
U.S. Counties
The distribution is based on data from 3,074 U.S. counties and county equivalents.
Prior Value
(11.5%)
Prior Value compares a measured value with the previously measured value. Confidence intervals were taken into account in determining the direction of the comparison.
Trend
This comparison measures the indicator’s values over multiple time periods.<br>The Mann-Kendall Test for Statistical Significance is used to evaluate the trend<br>over 4 to 10 periods of measure, subject to data availability and comparability.
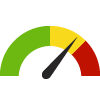
Adults 20+ with Diabetes County: Jackson
Adults 20+ with Diabetes County: Jackson
11.3%
(2021)
Compared to:
MS Counties
The distribution is based on data from 82 Mississippi counties.
U.S. Counties
The distribution is based on data from 3,074 U.S. counties and county equivalents.
Prior Value
(10.3%)
Prior Value compares a measured value with the previously measured value. Confidence intervals were taken into account in determining the direction of the comparison.
Trend
This comparison measures the indicator’s values over multiple time periods.<br>The Mann-Kendall Test for Statistical Significance is used to evaluate the trend<br>over 4 to 10 periods of measure, subject to data availability and comparability.
Adults 20+ with Diabetes County: Stone
Adults 20+ with Diabetes County: Stone
8.3%
(2021)
Compared to:
MS Counties
The distribution is based on data from 82 Mississippi counties.
U.S. Counties
The distribution is based on data from 3,074 U.S. counties and county equivalents.
Prior Value
(9.0%)
Prior Value compares a measured value with the previously measured value. Confidence intervals were taken into account in determining the direction of the comparison.
Trend
This comparison measures the indicator’s values over multiple time periods.<br>The Mann-Kendall Test for Statistical Significance is used to evaluate the trend<br>over 4 to 10 periods of measure, subject to data availability and comparability.
