
Search for Indicators
Food Systems
Use the dropdown menu to see data for different locations.
To learn more about food systems resources,Click Here
Indicator Gauge Icon Legend
Legend Colors
Red is bad, green is good, blue is not statistically different/neutral.
Compared to Distribution
 the value is in the best half of communities.
 the value is in the 2nd worst quarter of communities.
 the value is in the worst quarter of communities.
Compared to Target
 meets target;
  does not meet target.
Compared to a Single Value
 lower than the comparison value;
 higher than the comparison value;
 not statistically different from comparison value.
Trend

 non-significant change over time;
 significant change over time;
  no change over time.
Compared to Prior Value
 higher than the previous measurement period;
 lower than the previous measurement period;
 no statistically different change from previous measurement period.
State: Mississippi
General Food Insecurity
Value
Compared to:
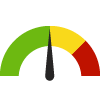
State: Mississippi Food Environment Index
State: Mississippi Food Environment Index
4.0
(2024)
Compared to:


U.S. States
The distribution is based on data from 50 U.S. states and the District of Columbia.
US Value
(7.7)
The regional value is compared to the national value.
Prior Value
(3.9)
Prior Value compares a measured value with the previously measured value. Confidence intervals were not taken into account in determining the direction of the comparison.
Trend
This comparison measures the indicator’s values over multiple time periods.<br>The Mann-Kendall Test for Statistical Significance is used to evaluate the trend<br>over 4 to 10 periods of measure, subject to data availability and comparability.
State: Mississippi Child Food Insecurity Rate
State: Mississippi Child Food Insecurity Rate
18.8%
(2021)
Compared to:

U.S. States
The distribution is based on data from 50 U.S. states and the District of Columbia.
US Value
(12.8%)
The regional value is compared to the national value.
Prior Value
(20.4%)
Prior Value compares a measured value with the previously measured value. Confidence intervals were not taken into account in determining the direction of the comparison.
Trend
This comparison measures the indicator’s values over multiple time periods.<br>The Mann-Kendall Test for Statistical Significance is used to evaluate the trend<br>over 4 to 10 periods of measure, subject to data availability and comparability.
State: Mississippi Food Insecurity Rate
State: Mississippi Food Insecurity Rate
16.3%
(2021)
Compared to:

U.S. States
The distribution is based on data from 50 U.S. states and the District of Columbia.
US Value
(10.4%)
The regional value is compared to the national value.
Prior Value
(16.2%)
Prior Value compares a measured value with the previously measured value. Confidence intervals were not taken into account in determining the direction of the comparison.
Trend
This comparison measures the indicator’s values over multiple time periods.<br>The Mann-Kendall Test for Statistical Significance is used to evaluate the trend<br>over 4 to 10 periods of measure, subject to data availability and comparability.
State: Mississippi
Governmental Programs
Value
Compared to:
State: Mississippi Students Eligible for the Free Lunch Program
State: Mississippi Students Eligible for the Free Lunch Program
73.7%
(2022-2023)
Compared to:

U.S. States
The distribution is based on data from 43 U.S. states.
US Value
(42.8%)
The regional value is compared to the national value.
Prior Value
(99.6%)
Prior Value compares a measured value with the previously measured value. Confidence intervals were not taken into account in determining the direction of the comparison.
Trend
This comparison measures the indicator’s values over multiple time periods.<br>The Mann-Kendall Test for Statistical Significance is used to evaluate the trend<br>over 4 to 10 periods of measure, subject to data availability and comparability.
State: Mississippi Food Insecure Children Likely Ineligible for Assistance
State: Mississippi Food Insecure Children Likely Ineligible for Assistance
27%
(2021)
Compared to:

U.S. States
The distribution is based on data from 50 U.S. states and the District of Columbia.
US Value
(25%)
The regional value is compared to the national value.
Prior Value
(20%)
Prior Value compares a measured value with the previously measured value. Confidence intervals were not taken into account in determining the direction of the comparison.
Trend
This comparison measures the indicator’s values over multiple time periods.<br>The Mann-Kendall Test for Statistical Significance is used to evaluate the trend<br>over 4 to 10 periods of measure, subject to data availability and comparability.
State: Mississippi Households Receiving SNAP with Children
State: Mississippi Households Receiving SNAP with Children
51.5%
(2018-2022)
Compared to:


US Value
(47.9%)
The regional value is compared to the national value.
Trend
This comparison measures the indicator’s values over multiple time periods.<br>The Mann-Kendall Test for Statistical Significance is used to evaluate the trend<br>over 4 to 10 periods of measure, subject to data availability and comparability.
State: Mississippi Households Receiving SNAP with Children (Count)
State: Mississippi Households Receiving SNAP with Children (Count)
79,576
Households
(2018-2022)
Compared to:
Trend
This comparison measures the indicator’s values over multiple time periods.<br>The Mann-Kendall Test for Statistical Significance is used to evaluate the trend<br>over 4 to 10 periods of measure, subject to data availability and comparability.
