
Search for Indicators


Feed the Seed : HealthyCommunity50 Challenge
A HealthyCommunity50 Challenge, 'Feed the Seed' is an urban food systems community revitalization project that catalyzes around community gardening, nutrition, grower's markets, and a neighborhood elementary school. The Challenge seeks to engage youth, families, and community members in activities around a community garden and teaching kitchen to increase nutrition and gardening knowledge, healthy food access, and consumption of fresh fruits and vegetables. The program fosters leadership among youth by giving them opportunities to motivate their school population and community toward healthy food choices, and works with teachers to integrate gardening activities into Common Core State Standards.
PARTNERS:
Gulf Coast Community Design Studio
Climb CDC
City of Gulfport
Coastal Family Health
Gaston Point Elementary School
SPONSORS:
AETNA Foundation
American Public Health Association
National Association of Counties
Indicator Gauge Icon Legend
Legend Colors
Red is bad, green is good, blue is not statistically different/neutral.
Compared to Distribution
 the value is in the best half of communities.
 the value is in the 2nd worst quarter of communities.
 the value is in the worst quarter of communities.
Compared to Target
 meets target;
  does not meet target.
Compared to a Single Value
 lower than the comparison value;
 higher than the comparison value;
 not statistically different from comparison value.
Trend

 non-significant change over time;
 significant change over time;
  no change over time.
Compared to Prior Value
 higher than the previous measurement period;
 lower than the previous measurement period;
 no statistically different change from previous measurement period.
 Significantly better than the overall value
 Significantly worse than the overall value
 Significantly different than the overall value
 No significant difference with the overall value
 No data on significance available
Value
Compared to:
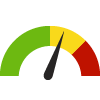
County: Harrison Food Insecurity Rate
County: Harrison Food Insecurity Rate
16.9%
(2021)
Compared to:


MS Counties
The distribution is based on data from 82 Mississippi counties.
U.S. Counties
The distribution is based on data from 3,140 U.S. counties and county equivalents.
MS Value
(16.3%)
The regional value is compared to the Mississippi State value.
US Value
(10.4%)
The regional value is compared to the national value.
Prior Value
(18.2%)
Prior Value compares a measured value with the previously measured value. Confidence intervals were not taken into account in determining the direction of the comparison.
Trend
This comparison measures the indicator’s values over multiple time periods.<br>The Mann-Kendall Test for Statistical Significance is used to evaluate the trend<br>over 4 to 10 periods of measure, subject to data availability and comparability.
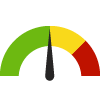
County: Harrison People Living Below Poverty Level
County: Harrison People Living Below Poverty Level
18.4%
(2018-2022)
Compared to:

MS Counties
The distribution is based on data from 82 Mississippi counties.
U.S. Counties
The distribution is based on data from 3,133 U.S. counties and county equivalents.
MS Value
(19.2%)
The regional value is compared to the Mississippi State value.
US Value
(12.5%)
The regional value is compared to the national value.
Trend
This comparison measures the indicator’s values over multiple time periods.<br>The Mann-Kendall Test for Statistical Significance is used to evaluate the trend<br>over 4 to 10 periods of measure, subject to data availability and comparability.
HP 2030 Target
(8.0%)
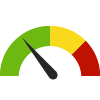
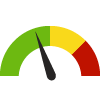
County: Harrison Children Living Below Poverty Level
County: Harrison Children Living Below Poverty Level
26.1%
(2018-2022)
Compared to:
MS Counties
The distribution is based on data from 82 Mississippi counties.
U.S. Counties
The distribution is based on data from 3,132 U.S. counties and county equivalents.
MS Value
(26.8%)
The regional value is compared to the Mississippi State value.
US Value
(16.7%)
The regional value is compared to the national value.
Trend
This comparison measures the indicator’s values over multiple time periods.<br>The Mann-Kendall Test for Statistical Significance is used to evaluate the trend<br>over 4 to 10 periods of measure, subject to data availability and comparability.
